Join the Cilium Slack
Cilium is an open source project that anyone in the community can use, improve, and enjoy. We'd love you to join us on Slack! Find out what's happening and get involved.
Join the SlackMetrics alone may lack context for effective issue diagnosis. Configuring metrics exporters and integrating them with monitoring systems can be error-prone and manual. Inadequate, inconsistent, or incorrect metrics can be misleading, resulting in incorrect conclusions about the application state. Troubleshooting often requires correlating metrics with traces for a comprehensive system understanding.

Cilium's Metrics and Tracing export feature provides a seamless and integrated solution empowering users to monitor, analyze, and optimize their Kubernetes environments with ease. By leveraging the power of Prometheus metrics, combined with Hubble's network behavior insights, Cilium enables users to gain deep visibility into their applications and network while simplifying the setup and configuration process. Cilium also integrates with various tracing systems, such as Jaeger, Zipkin, and OpenTelemetry, to provide distributed tracing capabilities. Cilium is optimized to handle high data volumes without compromising on performance.
Cilium captures a plethora of metrics, including latency, request rates, and error rates for your applications. These metrics are exported in a standardized Prometheus format, which can be easily integrated with your existing monitoring and visualization tools, enabling you to track your network performance in real-time.

Cilium supports popular distributed tracing frameworks like Jaeger and Zipkin. With this, you can visualize request flow through your services, identify bottlenecks and optimize for efficiency. Cilium’s tracing provides a granular view of service interactions, bringing clarity to complex distributed systems.
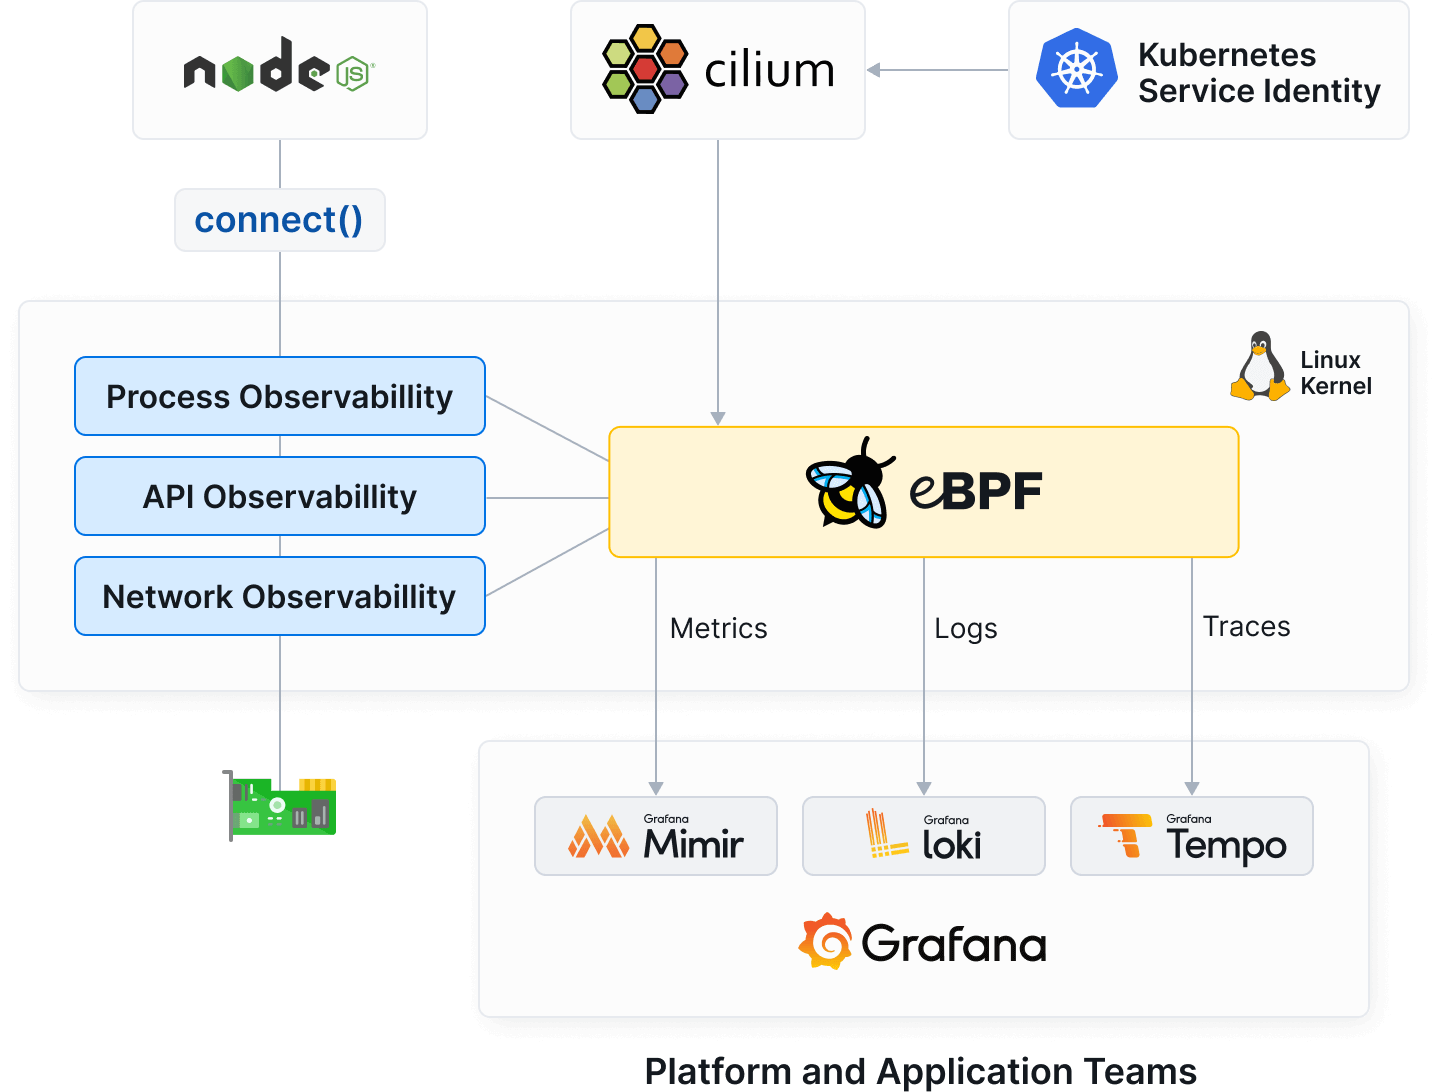
Cilium generates a rich stream of service-identity-aware connectivity metrics and events, which makes backend observability like the Grafana LGTM stack or Grafana Cloud the natural complement to Cilium’s robust connectivity observability capabilities.
Rafay Leverages Cilium for Visibility via Prometheus metrics and Hubble to deliver the automation developers and operations want with the right level of standardization, control, and governance platform teams need.
Cilium is an open source project that anyone in the community can use, improve, and enjoy. We'd love you to join us on Slack! Find out what's happening and get involved.
Join the SlackCilium has extensive documentation that covers its features and use cases. The docs also features tutorials for common user stories.
Read the DocsGet help with Cilium through Slack, Github, training, support, and FAQs. The community can also help you tell or promote your story around Cilium.
Get HelpDeep dive into Cilium and its features with labs provided by companies within the Cilium ecosystem
Try a Lab